Tampilkan postingan dengan label task 1 AC. Tampilkan semua postingan

The map and charts below indicate land use for different purposes in four different U.S. regions.

Essay topic: 
The map and charts below indicate land use for different purposes in four different U.S. regions.
Write a report for a university lecturer describing the information in the charts below.
You should write at least 150 works.

The map and the associated four pie charts illustrate the utility of land in four different area in America. It is obvious from the demonstration that the four regions Central, East, South and South west vary from each other in terms of the purposes of land using.
According to the pie charts, crops represent a significant percentage of land using in the Central, South as well as South West. This is true especially in the South where approximately 75% of the land is used for growing crops. Farming, on the other hand, comes to the second place contributing to 25% in the Central, 25% om the South and 20% in the South West respectively. The East region is different from the other three areas by devoting a majority of land to farming (75%) and only 20% of land to crops. Both of these four regions have a small proportion of land for other purpose covering only 18% in the East, 5% in the South, 19% in the South West and 19% in the Central area respectively.

Full essay evaluations
Sentence: Farming, on the other hand, comes to the second place contributing to 25 in the Central, 25 om the South and 20 in the South West respectively.
Error: om Suggestion: No alternate word
flaws:
Number of Paragraphs: 2 4
Attribute Value Ideal
Score: 7.5 out of 9
Category: Very Good Excellent
No. of Grammatical Errors: 0 2
No. of Spelling Errors: 1 2
No. of Sentences: 7 10
No. of Words: 176 200
No. of Characters: 761 1000
No. of Different Words: 81 100
Fourth Root of Number of Words: 3.642 4.0
Average Word Length: 4.324 4.6
Word Length SD: 2.534 2.4
No. of Words greater than 5 chars: 36 60
No. of Words greater than 6 chars: 32 50
No. of Words greater than 7 chars: 19 40
No. of Words greater than 8 chars: 15 20
Use of Passive Voice (%): 0 0
Avg. Sentence Length: 25.143 21.0
Sentence Length SD: 5.718 7.5
Use of Discourse Markers (%): 0.286 0.12
Sentence-Text Coherence: 0.541 0.35
Sentence-Para Coherence: 0.643 0.50
Sentence-Sentence Coherence: 0.173 0.07
Number of Paragraphs: 2 4

The charts below give information on the ages of the populations of Yemen and Italy in 2000 and projections for 2050

Essay topic: 
The charts below give information on the ages of the populations of Yemen and Italy in 2000 and projections for 2050
Summarise the information by selecting and reporting the main features, and make comparisons where relevant


The pie-charts indicate data about citizens of two countries, with different infrastructures, divided by age group in 2000 and expectations for 2050.
In 2000, the percentage of 15-59 year-old-people in Italy was 61.6 per cents while, in Yemen, this percentage was less by 15 per cents. The figures for people above 60 years were also higher in Italy (24.1%). Yemen, at the same index had only 3.6 per cents. However, young children, below the age of 14, in Yemen, outnumbered ones in Italy, 50.1 and 14.3 per cents respectively.
In 2050, Yemen is expected to have more residents at the age from 15 to 59 (57.3%) and old people (5.7%). In contrast, Italy is more likely to experience a reduction in the proportion of adolescents, middle aged people (46.2%) and children under 14 years old (11.5%). Nevertheless, the figures for elder people in Italy are predicted to be more by almost 18.3 per cents, whereas the percentage of young children is going to be less by 13 per cents.
Overall, two countries on the charts have completely different rates at old people and young children indexes.


Full essay evaluations
Attribute Value Ideal
Score: 7.5 out of 9
Category: Very Good Excellent
No. of Grammatical Errors: 0 2
No. of Spelling Errors: 0 2
No. of Sentences: 9 10
No. of Words: 186 200
No. of Characters: 862 1000
No. of Different Words: 101 100
Fourth Root of Number of Words: 3.693 4.0
Average Word Length: 4.634 4.6
Word Length SD: 2.701 2.4
No. of Words greater than 5 chars: 46 60
No. of Words greater than 6 chars: 36 50
No. of Words greater than 7 chars: 29 40
No. of Words greater than 8 chars: 21 20
Use of Passive Voice (%): 0 0
Avg. Sentence Length: 20.667 21.0
Sentence Length SD: 6.498 7.5
Use of Discourse Markers (%): 0.556 0.12
Sentence-Text Coherence: 0.447 0.35
Sentence-Para Coherence: 0.691 0.50
Sentence-Sentence Coherence: 0.097 0.07
Number of Paragraphs: 4 4

Under British and Australian laws a jury in a criminal case has no access to information about the defendant's past criminal record. This protects the person who is being accused of the crime. Some lawyers have suggested that this practice should be changed and that a jury should be given all the past facts before they reach their decision about the case . Do you agree or disagree? Give reasons for your answers.

Essay topic: 
Under British and Australian laws a jury in a criminal case has no access to information about the defendant's past criminal record. This protects the person who is being accused of the crime.
Some lawyers have suggested that this practice should be changed and that a jury should be given all the past facts before they reach their decision about the case .
Do you agree or disagree? Give reasons for your answers.
Deeds in criminal case have achieved reputation as the most complicated ones. In Britain and Australia this case is even more impeded by the question of acquaintance of a jury by previous criminal actions of a defendant. Some lawyers suggested that jury should be informed of the previous cases. However, the accused person is defended from such kind of practice by the law of those countries. In my opinion, this question requires more careful consideration.
Initially, the practice of informing the jury of the criminal past of the accused prevents objective evaluation of the whole situation. Jury members could begin to think a bit stereotyped. For instance, if person was guilty of killing or maiming, the jury may consider that he or she is able to do this again. However, they may not take into account such facts that the defendant perpetrated this being in an affect or in order to defend himself. Hence, the verdict of the jury seems to be incorrect. However, previous crime records might help jury to identify the features of the person in the bar, and compare them with presented facts.
On the other hand, when the jury is not given the facts of past criminal record, they could not prefigure the whole responsibility of their decision. The accused may be recognized as guiltless. For example, high qualified lawyers are able to use loopholes in the laws to liberate their clients, even if defendant is guilty. Moreover, people who did many offenses in the past may look innocent. Therefore, the jury seems to be misled by the current position.
Given the evidence, the jury should only be given information of the accused person who was brought to trial many times. Therefore, this practice should be used according to the crime situation.


Full essay evaluations
Attribute Value Ideal
Score: 7.5 out of 9
Category: Very Good Excellent
No. of Grammatical Errors: 0 2
No. of Spelling Errors: 0 2
No. of Sentences: 18 15
No. of Words: 296 350
No. of Characters: 1421 1500
No. of Different Words: 156 200
Fourth Root of Number of Words: 4.148 4.7
Average Word Length: 4.801 4.6
Word Length SD: 2.566 2.4
No. of Words greater than 5 chars: 98 100
No. of Words greater than 6 chars: 84 80
No. of Words greater than 7 chars: 58 40
No. of Words greater than 8 chars: 30 20
Use of Passive Voice (%): 0 0
Avg. Sentence Length: 16.444 21.0
Sentence Length SD: 6.474 7.5
Use of Discourse Markers (%): 0.667 0.12
Sentence-Text Coherence: 0.31 0.35
Sentence-Para Coherence: 0.489 0.50
Sentence-Sentence Coherence: 0.063 0.07
Number of Paragraphs: 4 5

The diagram below show the development of the horse over a period of 40 million years

Essay topic: 
The diagram below show the development of the horse over a period of 40 million years
Write a report for a university lecture describing the information shown below


The diagram presents the evolution of the horse from Eohippus to modern kind, with particular significant changes in foot structure, in a 40-million-year period.
Initially, the first species of horse, which is called Eohippus, had a small body and a snout. It had tiny toes that were separate from each other. Eventually, about 10 million years after, ancestor of the modern horse evolved into Mesohippus, which body enlarged while the tail and snout became longer. At this point, the middle toe of its leg also enlarged.
Once the first two evolution stages finished, it can be seen that horse transformed into Merychippus with muzzle like a modern species of horse, developed thigh and an emerged mane, at about 15 million years ago. At the same time, two basidigital bones reduced, whereas the middle toe became even large, resembling a hoof. Over time, Merychippus evolved into well-known modern horse with developed elbow, ankle joints, long tail and mane. Here, reduced metacarpals turned into fetlock and a present hoof emerged.
As a result, a horse went through different evolutional stages before transforming into modern type.


Full essay evaluations
Sentence: As a result, a horse went through different evolutional stages before transforming into modern type.
Error: evolutional Suggestion: No alternate word
Attribute Value Ideal
Score: 7.5 out of 9
Category: Very Good Excellent
No. of Grammatical Errors: 0 2
No. of Spelling Errors: 1 2
No. of Sentences: 10 10
No. of Words: 183 200
No. of Characters: 923 1000
No. of Different Words: 114 100
Fourth Root of Number of Words: 3.678 4.0
Average Word Length: 5.044 4.6
Word Length SD: 2.594 2.4
No. of Words greater than 5 chars: 64 60
No. of Words greater than 6 chars: 45 50
No. of Words greater than 7 chars: 29 40
No. of Words greater than 8 chars: 21 20
Use of Passive Voice (%): 0 0
Avg. Sentence Length: 18.3 21.0
Sentence Length SD: 7.537 7.5
Use of Discourse Markers (%): 0.6 0.12
Sentence-Text Coherence: 0.381 0.35
Sentence-Para Coherence: 0.622 0.50
Sentence-Sentence Coherence: 0.03 0.07
Number of Paragraphs: 4 4

The tables below give information about the world population and distribution in 1950 and 2000, with an estimate of the situation in 2050

Essay topic: 
The tables below give information about the world population and distribution in 1950 and 2000, with an estimate of the situation in 2050


The tables present data about the number of people and the percentage of their distribution among six different regions in the world in 1950 and 2000, with predicted figures for 2050
It is noticeable that, with the increase in the population of the world, there are high figures for people distribution in Asia and Africa, while in North America and Europe these indexes are much less. Oceania is the only region that maintain the figures throughout all years shown.
Asia had the highest percentage in the distribution, making up over a half of the whole population of the world and this is predicted to be true in 2050. By contrast, Europe had only 22% of the population in 1950; this index decreased in 2000 to 12% and is likely to be less by 5% in 2050. Latin America had had 6% of the world population; this figure was higher by 3% in 2000 and is estimated to be the same in 2050
North America shown only 7%, 5% indexes in 1950 and 2000 respectively and is going to fall to 4% over the next fifty years. However, Africa, which had 9% of the world population, is predicted to have this figure twice as more in 2050.


Full essay evaluations
Attribute Value Ideal
Score: 7.5 out of 9
Category: Very Good Excellent
No. of Grammatical Errors: 0 2
No. of Spelling Errors: 0 2
No. of Sentences: 8 10
No. of Words: 206 200
No. of Characters: 886 1000
No. of Different Words: 96 100
Fourth Root of Number of Words: 3.788 4.0
Average Word Length: 4.301 4.6
Word Length SD: 2.469 2.4
No. of Words greater than 5 chars: 49 60
No. of Words greater than 6 chars: 35 50
No. of Words greater than 7 chars: 22 40
No. of Words greater than 8 chars: 19 20
Use of Passive Voice (%): 0 0
Avg. Sentence Length: 25.75 21.0
Sentence Length SD: 6.398 7.5
Use of Discourse Markers (%): 0.25 0.12
Sentence-Text Coherence: 0.484 0.35
Sentence-Para Coherence: 0.739 0.50
Sentence-Sentence Coherence: 0.107 0.07
Number of Paragraphs: 4 4

The table below shows the consumer durables( telephone,refrigerator, etc,) owned in Britain from 1972 to 1983. Write a report for a university lecturer describing the information shown below.

Essay topic: 
The table below shows the consumer durables( telephone,refrigerator, etc,) owned in Britain from 1972 to 1983.
Write a report for a university lecturer describing the information shown below.
The table shown represents the percentage of eight different household appliances which were used by British people between 1972 to 1983.
According to the table, from 1972 to 1983 the top three leading favorite appliances are television, refrigerator, and washing machine. Beginning in 1972 the percentages were 93,73 and 66. However by 1983 percentages have increased to 98,94 and 80 respectively. The next favorite was the telephone which increased from 42 to 77%, followed by central heating from 37% up to 64%, which was an increase of almost double. On the other hand, by 1983, the least purchased household appliances are the dishwashers, and video machine with 5% to 18%. probably due to the fact that video was not yet invented during those years (1972-1982) and washing machine only appeared on the market in 1978. It is interestingly to note that vacuum cleaner was not so popular in 1983, from 87% in 1972, down to zero percent in 1983.
By looking at the table, one can predict why television is the famous appliances from the beginning till the end of the study, is because television is the only appliances that served for entertainment.


Full essay evaluations
Attribute Value Ideal
Score: 7.5 out of 9
Category: Very Good Excellent
No. of Grammatical Errors: 0 2
No. of Spelling Errors: 0 2
No. of Sentences: 8 10
No. of Words: 193 200
No. of Characters: 929 1000
No. of Different Words: 113 100
Fourth Root of Number of Words: 3.727 4.0
Average Word Length: 4.813 4.6
Word Length SD: 2.765 2.4
No. of Words greater than 5 chars: 60 60
No. of Words greater than 6 chars: 52 50
No. of Words greater than 7 chars: 35 40
No. of Words greater than 8 chars: 28 20
Use of Passive Voice (%): 0 0
Avg. Sentence Length: 24.125 21.0
Sentence Length SD: 11.285 7.5
Use of Discourse Markers (%): 0.375 0.12
Sentence-Text Coherence: 0.43 0.35
Sentence-Para Coherence: 0.594 0.50
Sentence-Sentence Coherence: 0.078 0.07
Number of Paragraphs: 3 4

The graph below shows the way people of some country invested their money during the years 2001-2006.

Essay topic: 
The graph below shows the way people of some country invested their money during the years 2001-2006.
The two bars graph compares how the people in some country invested their finances between 2001 to 2006. It can be seen that the trends steadily increased. According to the legend, the shaded colour represents the bonds share whilst the dark shaded represents the stock share.
According to the first graph, the bond share had a consistent increase from 2001 to 2006. it started off with 100 billion share, then followed by almost 10% increase in every succeeding year, all except in 2003 and 2004 when the increases were only just under 5%. However, the last couple of years continued to rise.
One can see a similar pattern in the second graph, which shows a rising trend through the same period. In 2001 the stocks share was approximately 210 billion more than doubled when compared with the bond share, as well as in 2002 when the increase was more than 10%. In addition from 2003 to 2004 there was a massive stocks increased recorded, from 227 to 289 billion. Then the last two years the stocks share was also reaching in the highest level.
To sum up, the people who invested their money in the stock market in some country between 2001 to 2005, are proportionally equal. The higher the stocks climbed the higher the bonds shared.


Full essay evaluations
Attribute Value Ideal
Score: 8.0 out of 9
Category: Excellent Excellent
No. of Grammatical Errors: 0 2
No. of Spelling Errors: 0 2
No. of Sentences: 11 10
No. of Words: 217 200
No. of Characters: 992 1000
No. of Different Words: 124 100
Fourth Root of Number of Words: 3.838 4.0
Average Word Length: 4.571 4.6
Word Length SD: 2.232 2.4
No. of Words greater than 5 chars: 63 60
No. of Words greater than 6 chars: 41 50
No. of Words greater than 7 chars: 25 40
No. of Words greater than 8 chars: 12 20
Use of Passive Voice (%): 0 0
Avg. Sentence Length: 19.727 21.0
Sentence Length SD: 10.506 7.5
Use of Discourse Markers (%): 0.636 0.12
Sentence-Text Coherence: 0.357 0.35
Sentence-Para Coherence: 0.591 0.50
Sentence-Sentence Coherence: 0.031 0.07
Number of Paragraphs: 4 4

WRITING TASK 1 You should spend about 20 minutes on this task. The bar graph below shows the numbers of employed persons by job type and sex for Australia in the year 2003. Summarise the information by selecting and reporting the main features, and make comparisons where relevant. You should write at least 150 words.

Essay topic: 
WRITING TASK 1
You should spend about 20 minutes on this task.
The bar graph below shows the numbers of employed persons by job type and
sex for Australia in the year 2003.
Summarise the information by selecting and reporting the main features, and make
comparisons where relevant.
You should write at least 150 words.


The bar graph illustrates the numbers of males and females employed in different types of jobs in Australia in the year 2003. It is clearly seen that the number of people employed in different types of jobs varies significantly between males and females.
For males, highest number of people was employed as tradepersons and clerks, with almost 900 000 people each job. There was 650 000 people employed as professionals, closely followed by managers (about 610 000 people). Semi professionals and production sectors had about 500 000 employees, and the least number of people words as labourers (400 000 people).
As for females, there was a large variation in the different field of jobs, with most females being employed as clerks ( slightly more than 950 000 people). On the other hand, least number of females worked as tradepersons and in the production sector, with 100 000 people each.
Comparing both males and females, a similar trend of most people worked in clerical sector was observed. There was nine times more men than women was employed as tradepersons and five times more man than women employed in the production sector.


flaws: Sentence Length
flaws:
Sentence Length SD: 3.197 7.5
Attribute Value Ideal
Score: 8.0 out of 9
Category: Excellent Excellent
No. of Grammatical Errors: 0 2
No. of Spelling Errors: 0 2
No. of Sentences: 9 10
No. of Words: 189 200
No. of Characters: 923 1000
No. of Different Words: 90 100
Fourth Root of Number of Words: 3.708 4.0
Average Word Length: 4.884 4.6
Word Length SD: 2.565 2.4
No. of Words greater than 5 chars: 66 60
No. of Words greater than 6 chars: 43 50
No. of Words greater than 7 chars: 30 40
No. of Words greater than 8 chars: 18 20
Use of Passive Voice (%): 0 0
Avg. Sentence Length: 21 21.0
Sentence Length SD: 3.197 7.5
Use of Discourse Markers (%): 0.222 0.12
Sentence-Text Coherence: 0.519 0.35
Sentence-Para Coherence: 0.762 0.50
Sentence-Sentence Coherence: 0.241 0.07
Number of Paragraphs: 4 4

WRITING TASK 1 You should spend about 20 minutes on this task. The bar chart below shows figures for average UK salaries, broken up by city. Summarise the information by selecting and reporting the main features, and make comparisons where relevant. You should write at least 150 words.

Essay topic: 
WRITING TASK 1
You should spend about 20 minutes on this task.
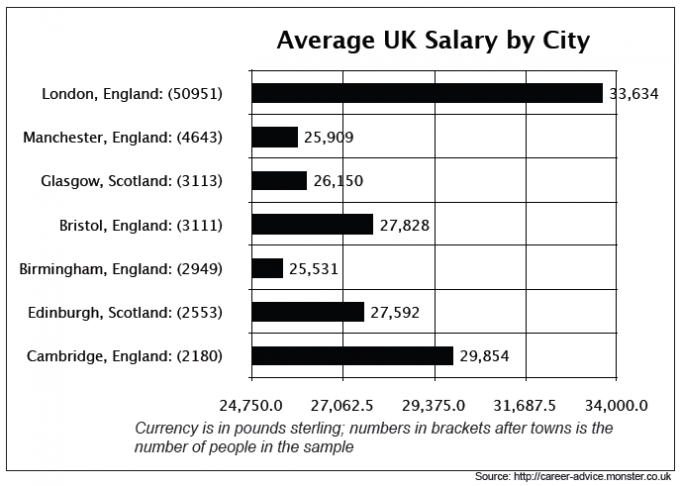
The bar chart below shows figures for average UK salaries, broken up by city.
Summarise the information by selecting and reporting the main features, and make comparisons where relevant.
You should write at least 150 words.


The bar chart illustrates the average UK salary, in 7 cities in England and Scotland. In England, there are London, Cambridge, Bristol, Manchester and Birmingham. In Scotland, there are Edinburgh and Glasgow. The figures are in pounds sterling.
From the graph, it is obvious that London has the highest salary, of 33,634 pounds, which is almost twice the amount of the second most earning city, Cambridge (29,854 pound). Bristol, Edinburgh, Manchester and Glasgow have an average salary of 26 500 pounds, while Birmingham has the lowest salary of 25 531 pound.
Taking a closer look on the chart, the number of people in the sample was also provided. It is shown that London has the highest sample size, of 50951 people. It has 25 times more sample size than Cambridge and Edinburgh which have 2180 and 2553 people respectively. Manchester has the second highest sample size of 4643, followed by an average of 3000 people in Glasgow, Bristol and Birmingham sample size.
Combining the average salary and number sample size together, London has the highest average salary and the biggest sample size. More details, such as job types are needed to deduce a conclusion as it is not mentioned if the sample size is skewed or not.


Attribute Value
Attribute Value Ideal
Score: 8.0 out of 9
Category: Excellent Excellent
No. of Grammatical Errors: 0 2
No. of Spelling Errors: 0 2
No. of Sentences: 12 10
No. of Words: 207 200
No. of Characters: 984 1000
No. of Different Words: 98 100
Fourth Root of Number of Words: 3.793 4.0
Average Word Length: 4.754 4.6
Word Length SD: 2.341 2.4
No. of Words greater than 5 chars: 85 60
No. of Words greater than 6 chars: 45 50
No. of Words greater than 7 chars: 23 40
No. of Words greater than 8 chars: 17 20
Use of Passive Voice (%): 0 0
Avg. Sentence Length: 17.25 21.0
Sentence Length SD: 7.096 7.5
Use of Discourse Markers (%): 0.417 0.12
Sentence-Text Coherence: 0.409 0.35
Sentence-Para Coherence: 0.636 0.50
Sentence-Sentence Coherence: 0.145 0.07
Number of Paragraphs: 4 4

The charts below give information on the ages of the population of Yemen and Italy in 2000 and projections for 2050.

Essay topic: 
The charts below give information on the ages of the population of Yemen and Italy in 2000 and projections for 2050.
Summarize the information by selecting and reporting the main features, and make comparisons where relevant.


Given are figure concerning the ages of residents of Yemen and Italy in 2000, as well as the forecasts for 2050. In general, it can be seen that the 15-59 years-old is the group accounting for the biggest proportion.
In 2000, the figure for 0-14 years of age in Yemen was ahead of that in Italy by a wide margin, 50.1% for the former and 14.3 % for the latter. To turn to people aged between 15 and 59, the figure for Italy was 61.6%, as against 46.3 for Yemen. In the oldest age group Italy's over-60-year-olds was nearly 8 times as many as Yemen's, with 24.1% and 3.6% respectively.
It is presented that in 2050. the percentage of over-60-year-olds Yemenis will increase to 5.7% while the figure for the age group ranging from 0 to 14 years old will drop to 37.0%. A similar pattern is repeated in Italy, with 42.3% for the former and 11.5% for the latter. There is a different trend in the figure of 15-59 years old age group of two given countries. It is projected that in Yemen, there will be more people in the age group of 15-59 years old which reaches 57.3% in total population. By contrast, the figure for this group in Italy is expected to go down from 61.6% to 46,2% in 2050.


Sentence: Given are figure
Sentence: Given are figure concerning the ages of residents of Yemen and Italy in 2000, as well as the forecasts for 2050.
Description: The fragment figure concerning the is not usually preceded by are
Suggestion: Possible agreement error: Replace figure with figures
Attribute Value Ideal
Score: 7.5 out of 9
Category: Very Good Excellent
No. of Grammatical Errors: 1 2
No. of Spelling Errors: 0 2
No. of Sentences: 10 10
No. of Words: 224 200
No. of Characters: 929 1000
No. of Different Words: 111 100
Fourth Root of Number of Words: 3.869 4.0
Average Word Length: 4.147 4.6
Word Length SD: 2.212 2.4
No. of Words greater than 5 chars: 45 60
No. of Words greater than 6 chars: 30 50
No. of Words greater than 7 chars: 19 40
No. of Words greater than 8 chars: 15 20
Use of Passive Voice (%): 0 0
Avg. Sentence Length: 22.4 21.0
Sentence Length SD: 5.314 7.5
Use of Discourse Markers (%): 0.3 0.12
Sentence-Text Coherence: 0.438 0.35
Sentence-Para Coherence: 0.597 0.50
Sentence-Sentence Coherence: 0.095 0.07
Number of Paragraphs: 3 4

The two pie charts below show the marital status of Australia's and Canada's populations for 1999 and 2000 respectively.

Essay topic: 
The two pie charts below show the marital status of Australia's and Canada's populations for 1999 and 2000 respectively. Write a report for a university lecturer describing the information below.


Given are two pie chart comparing the rates of different matrimonial status in total population of Australia (1999) and Canada (2000). From the information supplied, it is evident that the married and single people accounted for the largest proportion in both countries.
As for legal spousal relationship, the figure for Australia was marginally ahead of Canada', 53% for the former and 41% for the latter. While 46% of Canada's inhabitants was single, the number for Australia was only 29%. Interestingly, there were more people in Canada opting to be single than in Australia.
To turn to the widowed one, for Australia it was 7%, whereas for Canada the figure was slightly greater, at 5%. There was less marked difference between the percentage of the divorced and the unofficially divorced in both countries as the deviation was just 1%.
Noticeably, 1% of Australia' population was same-sex married couple, while in Canada there was nos official record for this category of marital status.


It is on top
Attribute Value Ideal
Score: 8.0 out of 9
Category: Excellent Excellent
No. of Grammatical Errors: 0 2
No. of Spelling Errors: 0 2
No. of Sentences: 8 10
No. of Words: 161 200
No. of Characters: 800 1000
No. of Different Words: 95 100
Fourth Root of Number of Words: 3.562 4.0
Average Word Length: 4.969 4.6
Word Length SD: 2.792 2.4
No. of Words greater than 5 chars: 64 60
No. of Words greater than 6 chars: 43 50
No. of Words greater than 7 chars: 33 40
No. of Words greater than 8 chars: 25 20
Use of Passive Voice (%): 0 0
Avg. Sentence Length: 20.125 21.0
Sentence Length SD: 3.689 7.5
Use of Discourse Markers (%): 0.5 0.12
Sentence-Text Coherence: 0.434 0.35
Sentence-Para Coherence: 0.722 0.50
Sentence-Sentence Coherence: 0.084 0.07
Number of Paragraphs: 4 4

The chart below shows the total number of Olympic medals won by twelve different countries.

Essay topic: 
The chart below shows the total number of Olympic medals won by twelve different countries.
Summarize the information by selecting and reporting the main features, and make comparisons where relevant.


Given are figures providing a comparison of the number of Olympic medals acquired by athletes in twelve different countries. It is evident from the information provided that gold medals make up the largest portion among gold, silver and bronze medallists.
The most outstanding feature of the graph is that the USA has the highest number of total medals as well as of each category, with practically 2300 in total and approximately 500 in separate categories. It is ahead of the figure for the Soviet Union, the country comes next, by a wide margin, with about 1000 decorations in total. When it comes to Japan, this country ranks last with merely 400 medals, which is nearly half as many as the Soviet Union and one-eighth as many as the USA.
There is less marked difference in the figure for the rest nations, which is hovering around 500 medals, also in the number of each type of medal.


Attribute Value
Attribute Value Ideal
Score: 7.5 out of 9
Category: Very Good Excellent
No. of Grammatical Errors: 0 2
No. of Spelling Errors: 0 2
No. of Sentences: 6 10
No. of Words: 156 200
No. of Characters: 719 1000
No. of Different Words: 93 100
Fourth Root of Number of Words: 3.534 4.0
Average Word Length: 4.609 4.6
Word Length SD: 2.448 2.4
No. of Words greater than 5 chars: 49 60
No. of Words greater than 6 chars: 29 50
No. of Words greater than 7 chars: 19 40
No. of Words greater than 8 chars: 13 20
Use of Passive Voice (%): 0 0
Avg. Sentence Length: 26 21.0
Sentence Length SD: 5.416 7.5
Use of Discourse Markers (%): 0.333 0.12
Sentence-Text Coherence: 0.473 0.35
Sentence-Para Coherence: 0.718 0.50
Sentence-Sentence Coherence: 0.075 0.07
Number of Paragraphs: 3 4

The diagram below shows how coffee is produced and prepared for sale in supermarkets and shops.

Essay topic: 
The diagram below shows how coffee is produced and prepared for sale in supermarkets and shops. Summarize the information by selecting and reporting the main features, and make comparisons where relevant.


Given is a diagram illustrating the process by which coffee is produced and made ready for sale in the market.
Prior to the actually processing the coffee, it is necessary for the producer to collect the coffee beans. They are then dried carefully in the sun before workers roasting them.
The quick cooling the beans is the next stage. After this, they are ground into the powder form, followed by being mixed with heated water. Then, the workers strain the mixture to separate the coffee part from the liquid part.
Having frozen the extracted coffee in the cooler, the frozen liquid are then ground again. In the last step, the workers use a vacuum to dry frozen coffee powder. At this point, the evaporation of water occurs.
After the long process of production, the final product is mechanically packed into different jars and ready to be distributed to supermarkets or shops and purchased by consumers.


It is on top
Attribute Value Ideal
Score: 8.0 out of 9
Category: Excellent Excellent
No. of Grammatical Errors: 0 2
No. of Spelling Errors: 0 2
No. of Sentences: 10 10
No. of Words: 155 200
No. of Characters: 734 1000
No. of Different Words: 93 100
Fourth Root of Number of Words: 3.528 4.0
Average Word Length: 4.735 4.6
Word Length SD: 2.38 2.4
No. of Words greater than 5 chars: 53 60
No. of Words greater than 6 chars: 29 50
No. of Words greater than 7 chars: 19 40
No. of Words greater than 8 chars: 13 20
Use of Passive Voice (%): 0 0
Avg. Sentence Length: 15.5 21.0
Sentence Length SD: 5.445 7.5
Use of Discourse Markers (%): 0.4 0.12
Sentence-Text Coherence: 0.362 0.35
Sentence-Para Coherence: 0.687 0.50
Sentence-Sentence Coherence: 0.064 0.07
Number of Paragraphs: 5 4

The graph and table below give information about water use worldwide and water consumption in two different countries.

Essay topic: 
The graph and table below give information about water use worldwide and water consumption in two different countries.
A glance at the graph and table reveals global use of water in the 100-year period from 1000 to 2000 and the amount of water consumed in Brazil and Congo in 2000. It is evident that the world saw an exponential increase in water use for different sectors and Brazil was ahead of Congo by a wide margin in water consumption.
To be more specific, the water consumed for agricultural purpose dominated water use worldwide, which started at practically 500km3 in 1990, followed by a period of marked growth, with a peak of just over 3000km3 in 2000. Despite having similar pattern in the first half of 20th century which was the fact that the amount of water used for industries and households rose unremarkably to approximately 200km3 in 1950, in the second half, the gap widened. In 2000, the water for industrial use was twice as much as for domestic use, with well over 1000km3 and about 500km3 respectively.
There was a significant difference between the water consumption in Brazil and Congo in 2000. It was revealed that Brazil had a larger population and irrigated land, as against 5.2 million people and 100km3 respectively in Congo. As a consequence, there was more water used by a Brazilian than by a Congolese, with 359m3 for the former and 8m3 for the latter.


Sentence: There was a
Sentence: There was a significantly difference between the water consumption in Brazil and Congo in 2000.
Description: The fragment a significantly difference is rare
Suggestion: Possible agreement error: Replace significantly with adjective

Attribute Value Ideal
Score: 8.5 out of 9
Category: Excellent Excellent
No. of Grammatical Errors: 1 2
No. of Spelling Errors: 0 2
No. of Sentences: 8 10
No. of Words: 222 200
No. of Characters: 1030 1000
No. of Different Words: 118 100
Fourth Root of Number of Words: 3.86 4.0
Average Word Length: 4.64 4.6
Word Length SD: 2.657 2.4
No. of Words greater than 5 chars: 68 60
No. of Words greater than 6 chars: 45 50
No. of Words greater than 7 chars: 30 40
No. of Words greater than 8 chars: 22 20
Use of Passive Voice (%): 0 0
Avg. Sentence Length: 27.75 21.0
Sentence Length SD: 7.562 7.5
Use of Discourse Markers (%): 0.25 0.12
Sentence-Text Coherence: 0.458 0.35
Sentence-Para Coherence: 0.649 0.50
Sentence-Sentence Coherence: 0.089 0.07
Number of Paragraphs: 3 4

The graphs below show the type of music albums purchased by people in Britain according to sex and age

Essay topic: 
The graphs below show the type of music albums purchased by people in Britain according to sex and age


Given are figures providing a comparison of the proportion of music albums sales in Great Britain in different genre according to age and sex. It is evident from the information that the similar figures of pop and rock music are marked different as against to classical music.
As for all 3 different kinds, males are ahead of their female counterparts, for example, in pop music, it is just over 20% for the former compared to virtually 14% for the latter. The figures of different age groups in pop and rock music see a similar pattern. In these categories, the age group ranging from 25 to 34 ranks first, followed closely by 16-24-year-olds. People who are 45 years old and over come bottom, which is one-third as many as people in the 33-45 age group.
By stark contrast, to turn to classical music, while 20% of 45 and over age group purchase albums of this type, only practically 15% of people aging from 25 to 34 do so. There is a less remarkable discrepancy between the figures for the youngest age group and 35-44-year-olds, with merely 1% and 3% respectively.


It is on top
Attribute Value Ideal
Score: 8.0 out of 9
Category: Excellent Excellent
No. of Grammatical Errors: 0 2
No. of Spelling Errors: 0 2
No. of Sentences: 8 10
No. of Words: 191 200
No. of Characters: 853 1000
No. of Different Words: 110 100
Fourth Root of Number of Words: 3.718 4.0
Average Word Length: 4.466 4.6
Word Length SD: 2.564 2.4
No. of Words greater than 5 chars: 52 60
No. of Words greater than 6 chars: 40 50
No. of Words greater than 7 chars: 26 40
No. of Words greater than 8 chars: 21 20
Use of Passive Voice (%): 0 0
Avg. Sentence Length: 23.875 21.0
Sentence Length SD: 5.967 7.5
Use of Discourse Markers (%): 0.375 0.12
Sentence-Text Coherence: 0.452 0.35
Sentence-Para Coherence: 0.632 0.50
Sentence-Sentence Coherence: 0.112 0.07
Number of Paragraphs: 3 4